UNITDSPR Share Price Analysis Today (Nifty 500 Stock)
📊 Overview
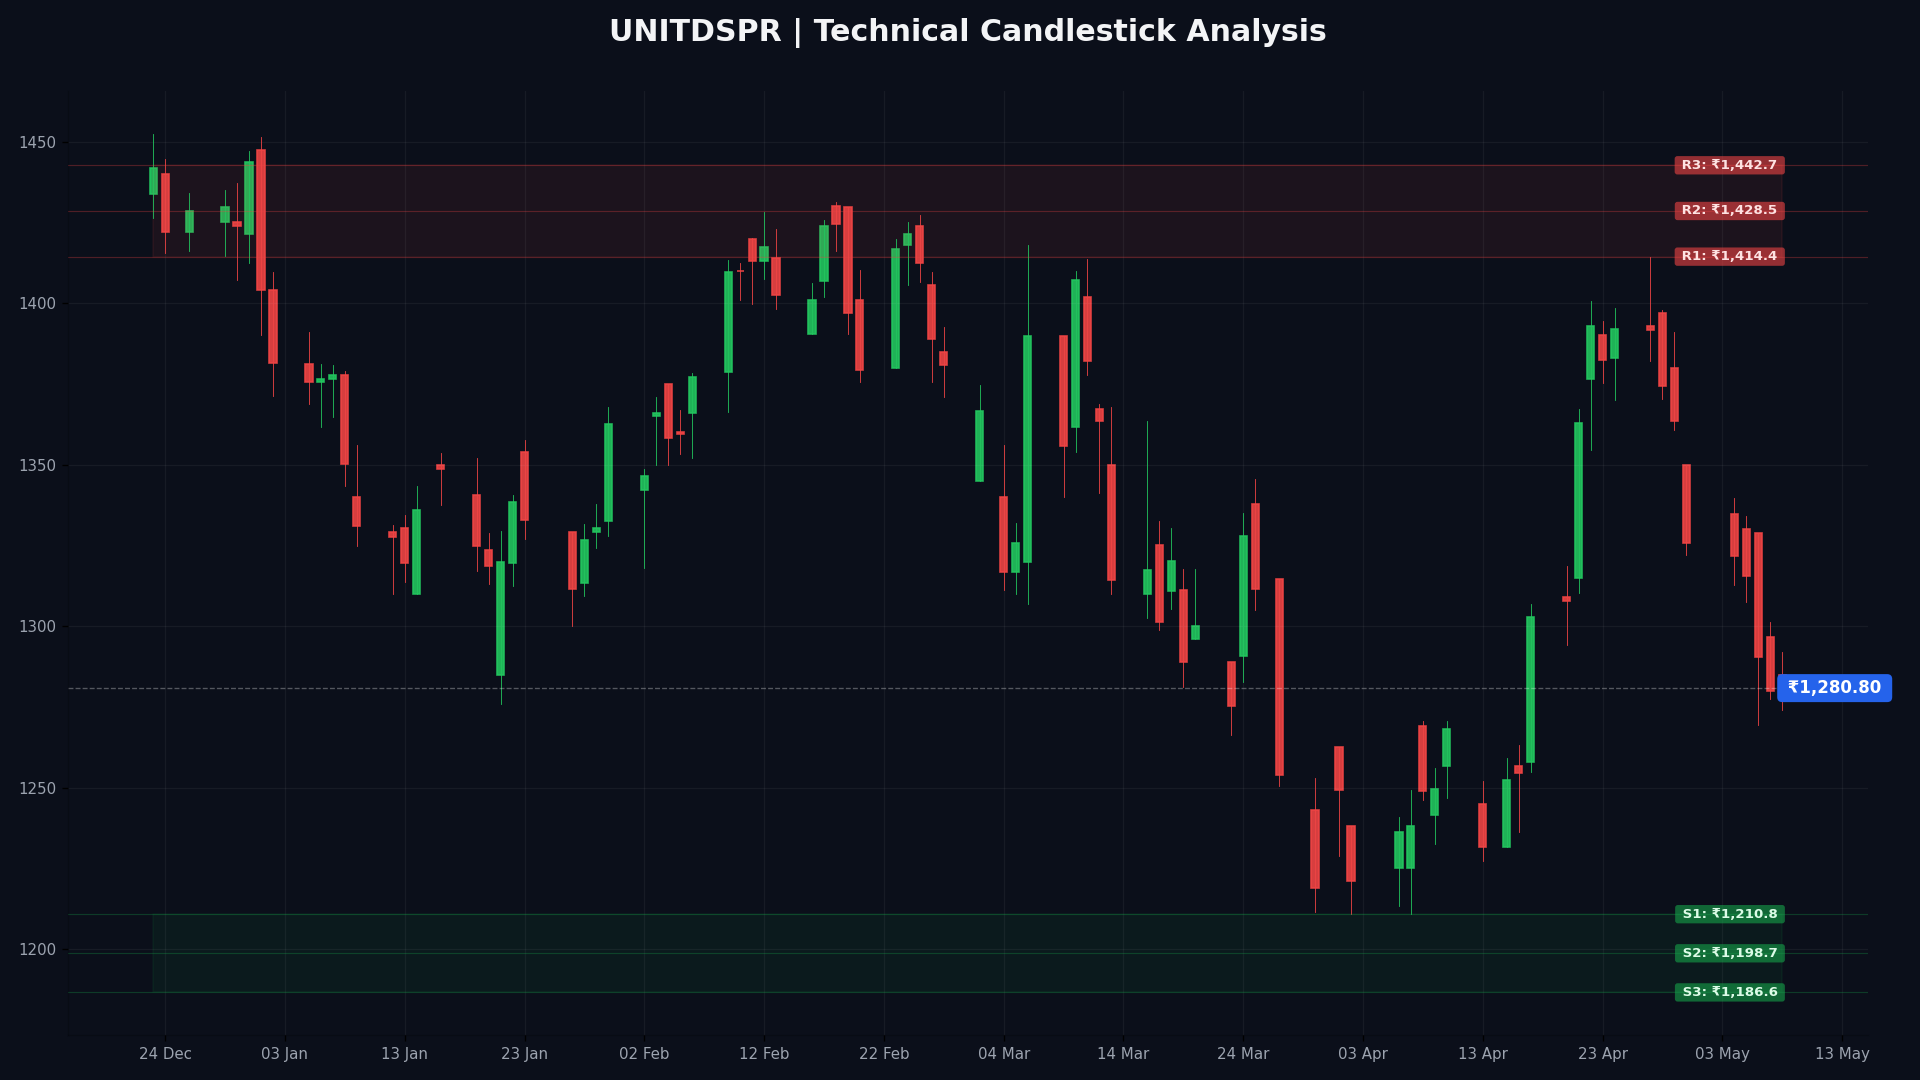
📊 Technical Price Structure
📈 UNITDSPR Technical Analysis Overview
UNITDSPR is one of the actively tracked stocks in the Nifty 500 universe. Based on current moving average structure and momentum indicators, the stock is showing a Weak long term trend while the short term direction currently remains Upward. This combination helps traders understand whether the broader trend and near-term momentum are aligned for continuation or reversal opportunities.
The current price of UNITDSPR is ₹1280.80, and the RSI stands at 42.27, indicating Neutral momentum. This suggests that the stock is moving sideways in the short term.
From a trend perspective, price action relative to moving averages indicates that the stock is Price below EMA20, EMA50, EMA200. Key support levels are near 1210.80, 1198.69, while resistance levels are around 1414.40, 1428.54.
Overall, UNITDSPR stock currently maintains a Weak long term structure while the short term trend remains Upward. Traders should monitor support-resistance zones, RSI behavior, and breakout confirmation to assess whether the short term momentum aligns with the broader trend.
📉 Long Term Trend Structure
- Price below EMA20, EMA50, EMA200
- Momentum aligned with structure
📊 Momentum (RSI)
- RSI: 42.27
- Neutral momentum
📉 MACD Observation
- Trend remains mixed
- Trend confirms structural bias
📊 Overall Technical View
- Momentum → Neutral
- Trend → Weak
🎯 Key Levels
🟢 Support Zones
🔴 Resistance Zones
📊 Fibonacci Retracement
| Level | Value |
|---|---|
| 23.6% | 1269.33 |
| 38.2% | 1351.63 |
| 50.0% | 1418.15 |
| 61.8% | 1484.67 |
| 78.6% | 1579.37 |
📈 Moving Averages
| EMA | Value | SMA | Value |
|---|---|---|---|
| EMA5 | 1297.96 | SMA5 | 1297.64 |
| EMA9 | 1311.39 | SMA9 | 1327.02 |
| EMA20 | 1315.73 | SMA20 | 1317.01 |
| EMA50 | 1324.01 | SMA50 | 1321.42 |
| EMA100 | 1342.29 | SMA100 | 1353.61 |
| EMA200 | 1363.45 | SMA200 | 1355.77 |
📊 MACD Backtested Signals (Historical)
| Date | Signal | Close | T+1 Open | T+1 High | T+1 Low | T+1 Move % | T+1 Loss % | T+5 High | T+5 Low | T+5 Move % | T+5 Loss % | Strength | Confidence | Strategy |
|---|---|---|---|---|---|---|---|---|---|---|---|---|---|---|
| 2026-04-10 | Bullish | 1268.20 | 1245.0 | 1251.90 | 1227.30 | 0.55 | 1.42 | 1318.5 | 1227.30 | 3.97 | 3.23 | 45.66 | 55.06 | Success |
| 2026-02-27 | Bearish | 1380.80 | 1345.0 | 1374.70 | 1345.00 | 0.00 | 2.21 | 1417.9 | 1306.80 | 5.36 | 2.69 | 100.00 | 80.04 | No |
| 2026-01-29 | Bullish | 1330.40 | 1332.6 | 1368.00 | 1328.00 | 2.66 | 0.35 | 1375.0 | 1318.00 | 3.35 | 0.93 | 66.12 | 59.03 | Success |
| 2025-11-19 | Bearish | 1411.70 | 1410.0 | 1432.80 | 1406.70 | 0.23 | 1.62 | 1463.5 | 1395.30 | 1.16 | 3.67 | 100.00 | 61.74 | Success |
| 2025-10-16 | Bullish | 1359.10 | 1358.6 | 1369.30 | 1350.20 | 0.79 | 0.62 | 1376.3 | 1344.70 | 1.27 | 1.06 | 20.53 | 22.56 | Success |
| 2025-10-13 | Bearish | 1316.10 | 1316.1 | 1323.60 | 1300.00 | 1.22 | 0.57 | 1376.3 | 1300.00 | 1.22 | 4.57 | 82.78 | 62.62 | Success |
| 2025-10-01 | Bullish | 1346.70 | 1347.0 | 1368.90 | 1341.20 | 1.63 | 0.43 | 1368.9 | 1325.50 | 1.65 | 1.57 | 100.00 | 61.88 | Success |
| 2025-09-29 | Bearish | 1308.50 | 1308.6 | 1342.10 | 1291.00 | 1.34 | 2.56 | 1368.9 | 1291.00 | 1.34 | 4.62 | 85.77 | 65.12 | Success |
| 2025-07-31 | Bullish | 1340.20 | 1336.0 | 1337.40 | 1316.50 | 0.10 | 1.46 | 1349.1 | 1283.80 | 0.66 | 4.21 | 100.00 | 61.23 | Success |
| 2025-07-25 | Bearish | 1309.60 | 1309.7 | 1325.10 | 1302.80 | 0.53 | 1.18 | 1348.0 | 1298.80 | 0.82 | 2.93 | 71.25 | 46.73 | Success |
| 2025-07-16 | Bullish | 1377.20 | 1381.7 | 1399.90 | 1376.50 | 1.32 | 0.38 | 1399.9 | 1336.90 | 1.65 | 2.93 | 100.00 | 66.16 | Success |
| 2025-06-11 | Bearish | 1503.80 | 1505.0 | 1514.30 | 1483.00 | 1.46 | 0.62 | 1514.3 | 1442.10 | 4.10 | 0.70 | 100.00 | 71.51 | Success |
| 2025-06-05 | Bullish | 1610.00 | 1623.5 | 1627.60 | 1586.40 | 0.25 | 2.29 | 1645.0 | 1482.60 | 2.17 | 7.91 | 100.00 | 76.26 | Success |
| 2025-05-08 | Bearish | 1537.20 | 1525.1 | 1544.30 | 1498.50 | 1.74 | 1.26 | 1579.9 | 1498.50 | 2.52 | 2.78 | 100.00 | 71.90 | Success |
| 2025-03-06 | Bullish | 1332.85 | 1339.1 | 1340.90 | 1323.00 | 0.13 | 1.20 | 1362.4 | 1301.00 | 2.22 | 2.39 | 100.00 | 62.29 | Success |
| 2025-02-11 | Bearish | 1389.55 | 1392.0 | 1412.00 | 1366.85 | 1.81 | 1.44 | 1412.0 | 1325.55 | 4.61 | 1.62 | 100.00 | 79.44 | Success |
| 2025-02-01 | Bullish | 1498.10 | 1470.0 | 1498.00 | 1455.00 | 1.90 | 1.02 | 1508.9 | 1400.00 | 0.72 | 6.55 | 100.00 | 78.64 | Success |
| 2025-01-08 | Bearish | 1575.80 | 1561.0 | 1598.50 | 1561.00 | 0.00 | 2.40 | 1598.5 | 1388.00 | 11.92 | 1.44 | 22.69 | 56.08 | No |
| 2024-11-18 | Bullish | 1470.80 | 1479.0 | 1505.95 | 1475.25 | 1.82 | 0.25 | 1543.7 | 1466.90 | 4.96 | 0.27 | 100.00 | 75.12 | Success |
| 2024-10-03 | Bearish | 1564.10 | 1565.0 | 1571.90 | 1527.25 | 2.41 | 0.44 | 1571.9 | 1491.75 | 4.63 | 0.50 | 100.00 | 77.50 | Success |
- Weak alignment in behavior
- AI Confidence Score: 60.0%
👉 Market appears neutral
📌 Important Note
This stock analysis is based on technical indicators like RSI, EMA, and MACD. It is intended for educational purposes only and should not be considered financial advice.
🔍 Explore More Stocks
Check other Nifty 200 stock analysis: RELIANCE, TCS, HDFCBANK, INFY
It does not constitute investment advice or research reports under SEBI regulations.
Consult a SEBI-registered financial advisor before making any decisions. Stock markets are subject to risks.